Two pupils, and one is averaged away.
Deep in the brainstem sits the locus coeruleus, the brain’s main source of noradrenaline and the only supplier of it to the cortex, and although you cannot watch it fire, it drives the sympathetic tone that widens the pupil, which makes the black disc a needle you can read from across a room. There are two of these needles, and they don’t always read the same.
A pupillometry conjecture · DR McCulloch
Most instruments measure one pupil or average the two into a single diameter, and an average keeps only what the two eyes share, so the difference between left and right is thrown away before anyone looks at it. If that asymmetry is what matters, as my own eyes seem to show when I do hard mental arithmetic, the instrument has already erased it. I built an instrument that shows the erasure as it happens, set it beside a sequence of photographs of my own eyes taken during that arithmetic and, in July 2026, re-analysed a published eye-tracking dataset of 56 children with the two eyes kept apart.
START WITH TWO CASESTwo cases with the same average
Here are two arousal signatures with the same average pupil, one nearly symmetric and one with the right pupil half a millimetre wider than the left. A binocular device logs a single number for each, 4.35 mm both times, and everything that tells them apart is in |L−R|, the gap between the left and right pupil, which is the quantity the average throws away.
A broadly raised, roughly symmetric arousal signature, with the two pupils within a tenth of a millimetre of each other, so their mean is a fair summary of both and a binocular device records it well.
Here the right pupil is half a millimetre wider than the left, a difference small enough that the two eyes look almost identical. The mean is 4.35 mm, the same as in the symmetric case, so an average cannot tell the two cases apart, and the one quantity that could, |L−R|, is the one averaging deletes.
My own eyes under load
This is a sequence of close-ups of my own eyes taken across one piece of mental arithmetic and annotated in my handwriting, with blue dots for resting tone on both sides that turn red as the asymmetric demand climbs and thin red rules drawn across both pupils so the gap between them can be compared from frame to frame. The pupils start symmetric at baseline, by step 3 the right pupil is clearly the larger and at step 4 it is still visibly larger, a little before the frame I labelled “lost it”.
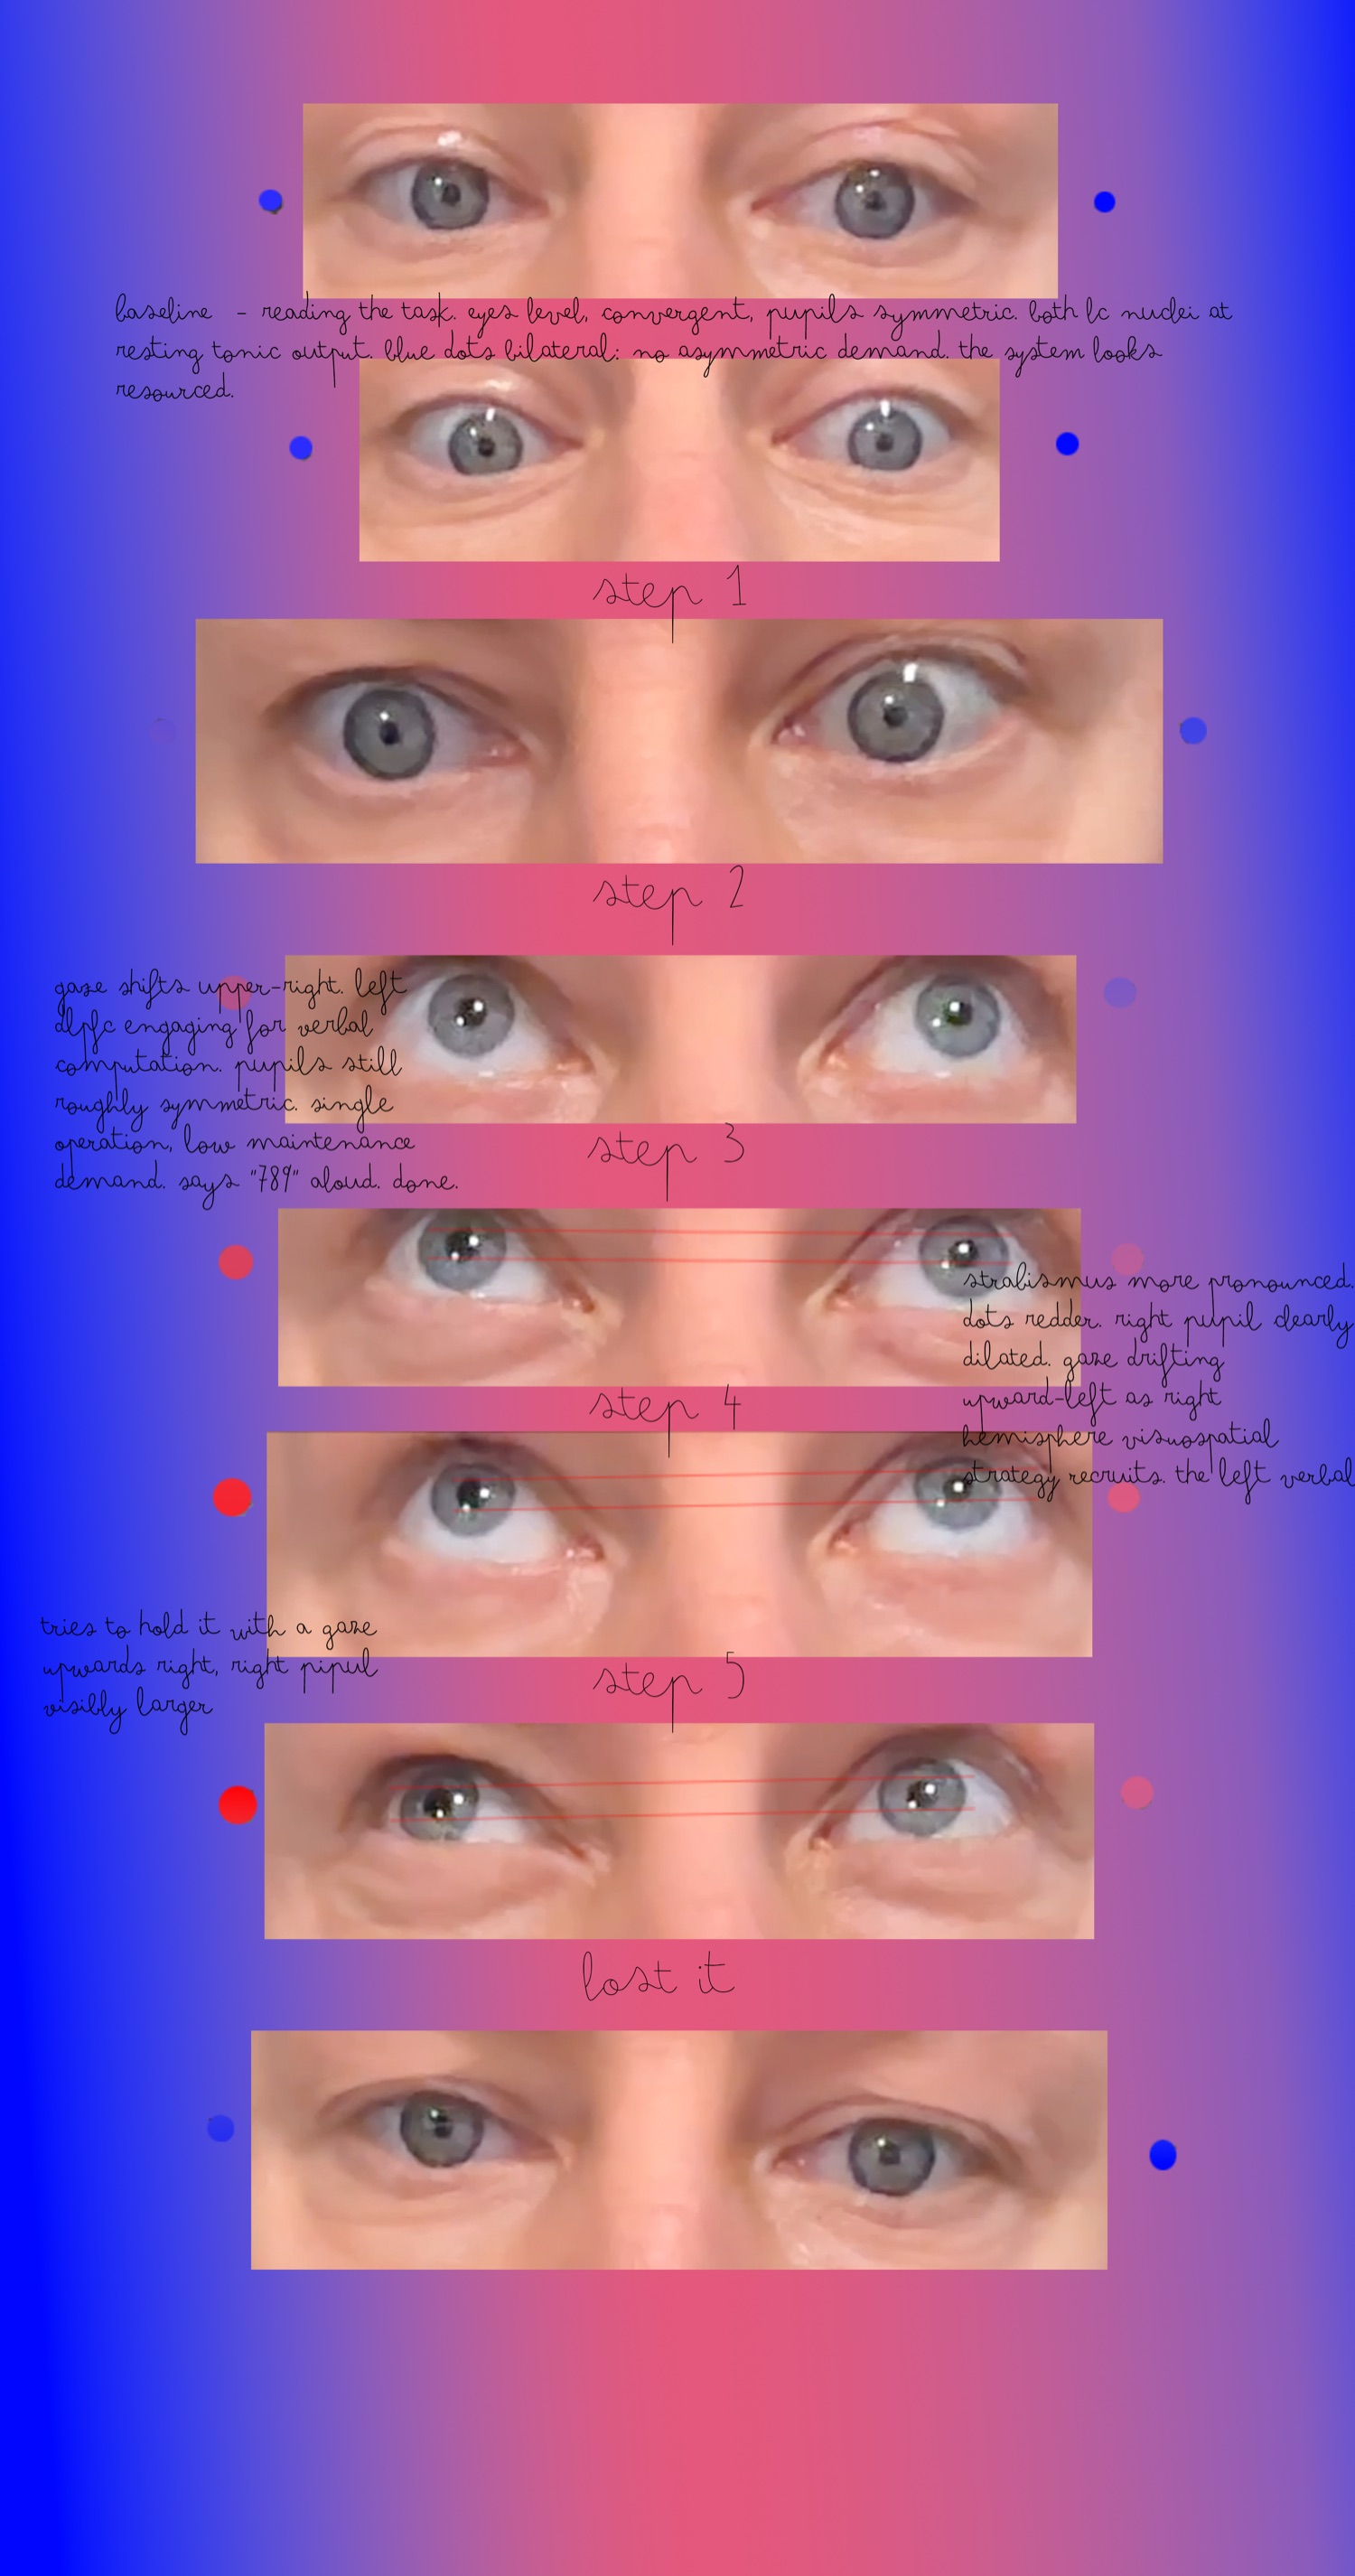
- baselinereading the task. eyes level, convergent, pupils symmetric. both lc nuclei at resting tonic output. blue dots bilateral: no asymmetric demand. the system looks resourced.
- step 1–2gaze shifts upper-right. left dlpfc engaging for verbal computation. pupils still roughly symmetric. single operation, low maintenance demand. says “789” aloud. done.
- step 3strabismus more pronounced. dots redder. right pupil clearly dilated. gaze drifting upward-left as right hemisphere visuospatial strategy recruits. the left verbal …
- step 4tries to hold it with a gaze upwards right, right pupil visibly larger
This is one person in one session on one task, and I have a real strabismus that muddies the very divergence the plate shows, so some of what you see comes from the alignment of my eyes and some from my arousal, and on its own the plate settles nothing. I include it because it is where the conjecture came from.
The arithmetic puzzle
What drives the dilation is mental arithmetic that gets harder at each step. The puzzle comes from my own session of 12 February 2026, titled “High IQ with low left locus coeruleus activation”, and it was built to load one thing only. The base task is 347 → subtract 58 → ×3 → add 167 → ÷7, which runs 347 → 289 → 867 → 1034 → 147.71.
Every operation is easy given time, which takes arithmetic ability out of the test on purpose and leaves maintenance: how long you can hold a running number while the next operation runs on top of it.
The load builds across the steps until a division by a number that is not a factor (7 into a four-digit number) makes you hold the running result while you work a fresh long division, and that is the step where the held number goes.
When the number goes it goes all at once: the sustained firing that holds it collapses, and the number is there one moment and gone the next.
Pick a tier and step through the chain, watching the right pupil climb until it goes.
In this puzzle the pupil is only where I read the load. As the load of holding numbers climbs, it drives task-evoked dilation through the locus coeruleus and its noradrenaline (the LC-NE system), and in the asymmetry I reported in my own eyes the right pupil follows the climb and is widest at the collapse step. What an instrument does with two pupils that read differently →
How the pupil opens and closes
The pupil is a hole, the gap left between two opposing muscles in the iris, each wired to a different half of the autonomic nervous system, so a pupil reading is always the result of a subtraction, the parasympathetic ring pulling the hole shut against the sympathetic mesh hauling it open. The opening side is wired mostly ipsilaterally, each side of the body driving the pupil on its own side, which means the two eyes can widen by different amounts.
Sphincter pupillae
Two things close it. The light reflex, in which more light on the retina brings more sphincter tone and a smaller pupil, is a fast loop below the cortex, but the sphincter also fires in the near triad, where focusing on something close makes the pupil constrict along with convergence and accommodation, and that response does run through the cortex, so even the constricting muscle answers to two mechanisms.
Dilator pupillae
This is the arousal side, and it is largely ipsilateral, with each side’s sympathetic chain driving the pupil on its own side. Under load, central arousal (noradrenaline from the locus coeruleus) recruits this side, and because the wiring is ipsilateral it can widen one eye more than the other.
The light reflex is a short loop that never reaches the cortex, and the arousal side is the one connected to it, so the dilation of each eye may reflect, however faintly, how hard that side of the brain is being driven. As I explain under how loose the needle is, this mapping from each pupil to a hemisphere is an assumption I rely on and have not established.
What an instrument records
Both pupils here respond live to three sliders. LIGHT works the reflex and AROUSAL widens both pupils together, while COGNITIVE LOAD pulls them apart, modelling the right hemisphere being recruited and widening the right pupil past the left, which is the asymmetry my own eyes show during the arithmetic. At rest the two pupils read the same. Choose what the instrument is (the true state of both eyes, a binocular device that averages them or a device that samples one eye) and watch |L−R|, the gap between the two pupils, vanish as soon as you stop measuring both.
The pupils move on a model of ipsilateral recruitment that I set by hand at the scale of the real data: at full load the gap between them reaches about 0.7 mm, a little more than the largest average left–right gap of any child in the cohort (0.58 mm) and still under a millimetre. Averaging the two eyes erases a difference that small completely, and differences of that size are where the group difference in the cohort sits.
The cohort re-analysis
I re-analysed the binocular eye-tracking recordings that Cilia and colleagues published (27 autistic and 29 typically developing children), working from the raw trace of each eye and keeping the left and right pupils separate throughout. Every child watched the same images and videos on the same clock, so at each moment I subtracted the mean pupil diameter of the other children at that point in that clip, which removes the part of the response every child shares, mostly the light reflex, and leaves each child’s departure from the group in millimetres.
In the raw recordings the two groups’ pupils vary by the same amount within each trial, with a right-eye standard deviation of 0.215 mm in the autistic group and 0.209 mm in the typically developing group (Cohen’s d = 0.06, p = 0.83, where d is the gap between the groups measured in units of their spread and 0.8 or more is conventionally a large effect). Once the shared response is removed the groups separate: the autistic children’s residual standard deviation is higher, 0.222 against 0.171 mm (d = 0.94, p = 0.001), and so is their phasic amplitude (d = 0.93, p = 0.001). Removing the common response lowers the variability of the typically developing children, whose pupils follow the shared stimulus, and leaves the autistic children’s high, so the shared response had been inflating the variance within each group and hiding the difference between them.
The difference is present in both eyes (left eye d = 0.77), and it grows when I restrict the comparison to boys to remove the sex imbalance in the sample (d = 1.21, p = 0.0004). It holds when the reference is built only from typically developing children, so it is not an artefact of comparing a child against itself, and it does not correlate with autism severity as scored on the CARS scale (every |ρ| below 0.2).
The left–right gap needs no cleaning, because light constricts both pupils together and the reflex cancels when one is subtracted from the other: averaged over every moment of the recordings, the reference’s own left–right gap is 0.08 mm, against 0.21 mm in the children’s raw traces. The upper tail of the gap is heavier in the autistic group, where the 99th percentile of |L−R|, the gap a child’s eyes exceed only 1% of the time, averages 0.87 mm against 0.67 mm (d = 0.78, p = 0.007), and where left–right divergences held for 150 ms or longer happen nearly three times as often per minute. In both groups the correlation between the two eyes falls during those divergences.
27 autistic and 29 typically developing children make a small sample, and the autistic children contributed a little under half as much usable recording per child as the others (a median of 1.2 minutes against 2.7). The children were passively watching images and videos, with no cognitive load set or varied, so what this shows is a trait-level difference in how these pupils move, and it cannot show how they respond to being pushed. Nothing scaled with severity, and the direction of the asymmetry varies from child to child (near-symmetric on average), so the finding concerns the size of the left–right divergence and implies no fixed weaker side.
Neither result shows up under the usual ways of summarising a recording. The left–right results cannot exist once the two eyes are averaged or one eye is recorded alone, and the variability result appears only after the shared response is taken out.
That gives the conjecture a prediction I can check against published work. Kim and colleagues (2022) recorded one eye only, with an EyeLink 1000 Plus set to monocular recording according to their supplementary methods, so their pupil measures could not contain the left–right gap at all. Their tonic and phasic LC-NE measures, from the pupil and from EEG, were related mainly to ADHD symptoms, with weaker links to autism symptoms, and they suggest the LC-NE differences may reflect the overlap between autism and ADHD. If part of autism’s LC-NE signature is a left–right asymmetry, a one-eye instrument would be expected to follow ADHD, which on this account is the symmetric, global-arousal pattern, more closely than autism itself, so their result is also what you would see if the measurement cannot record the dimension along which autism’s signature varies. It is still a conjecture, and a testable one: record both eyes, keep them apart and look at |L−R|.
A developmental conjecture
Why would the two eyes of autistic children diverge further than those of typically developing children, with a heavier tail of left–right difference? One explanation, which I offer as a hypothesis to test, reads autism partly as a lateral difference, an asymmetry in activation between the two hemispheres, plausibly rooted in neural-crest laterality, the neural-crest cascade on which the sibling Pilearytix model is parameterised.
A left–right difference set that early in development would not stay local, since it would bias the connections between the hemispheres, and Anderson and colleagues (2011) reported reduced interhemispheric connectivity in autism. The conjecture rests on that mechanism, in which no region is missing and the two halves of the brain coordinate less tightly than they should.
On this hypothesis the autistic group’s heavier tail of left–right difference, together with a lower correlation between the eyes that is weaker and does not reach significance here, would be a bodily readout of reduced coordination between the hemispheres, with two hemispheres that coordinate less tightly showing up at the eyes as two pupils that diverge further and follow each other less closely.
The children in the Cilia cohort were not doing anything like the arithmetic ladder; they were young children simply watching images and video, so the difference in that data does not depend on a task and was recorded close to rest. That makes it arguably cleaner evidence than my own effort-driven dilation, since the heavier asymmetry appears with no executive load imposed at all. A resting difference that needs no hard task to show itself is what the developmental under-connectivity hypothesis predicts, so the hypothesis does not inherit the general-effort confound that weakens the arithmetic probe.
How loose the needle is
An instrument like this is easy to believe further than the evidence allows, so here is the case against my own argument. Joshi and colleagues (2016) recorded from the locus coeruleus directly and found that pupil size does follow its firing moment to moment, though activity in the colliculi and the cingulate cortex anticipated the pupil too. Megemont, McBurney-Lin and Yang (2022), recording in mice, qualified that sharply and gave their paper the title “Pupil diameter is not an accurate real-time readout of locus coeruleus activity”.
My conjecture is only a conjecture, and it began with n = 1: my own eyes on one task in one sitting, with a strabismus that muddies the very asymmetry the conjecture starts from. The pupil sums the light reflex and the arousal side into one number, lags by hundreds of milliseconds and reflects several neuromodulators at once, which makes it a needle on a very soft spring, and I am arguing that the difference between two such needles matters.
The wiring is a further problem. Not all of the dilation that comes with mental effort is sympathetic: Steinhauer and colleagues (2004) found that in room light much of the extra dilation during hard serial subtraction came from inhibition of the parasympathetic pathway at the oculomotor nucleus, and the locus coeruleus inhibits that nucleus directly as well as driving the sympathetic side (Szabadi 2012). The parasympathetic pathway takes its input from both sides of the brain, which is why light shone into one eye narrows both pupils, so that part of the dilation would be expected to widen the two eyes about equally. A left–right difference is more likely to come from the sympathetic share, which is wired separately for each side, and in their lit-room condition that was the smaller share of the effort-related dilation.
Two mechanisms that fit the same curve
The puzzle cannot separate the story of a left locus coeruleus deficit from ordinary limits on working memory, since held intermediate results decay past a load threshold in everyone. “It disappeared” is the standard sign of the phonological loop and central executive being overrun, and on its own it needs neither alpha-2A-to-alpha-1 noradrenergic spillover nor a lateralised locus coeruleus lesion to explain it.
The dilation is a weaker probe still, because the task-evoked pupil response indexes central effort in general and is not specific to left-hemisphere engagement or to the integrity of the locus coeruleus.
An earlier result of my own had already pushed me here: my right pupil dilated for verbal, visuospatial and planning tasks alike, which ruled out the contralateral-content reading and left “right prefrontal executive effort” as what the dilation refers to. The EYES plate shows the same right-pupil pattern, which points to general effort in the right prefrontal cortex and is no evidence for anything specific to the left locus coeruleus.
So the arithmetic probe shows dilation that rises with load and a ceiling on how much can be held, and it cannot place that ceiling in the left locus coeruleus or pin it on noradrenaline, because two mechanisms fit the same curve equally well.
The dilation in my own eyes during the arithmetic is the weak probe, confounded by effort. The stronger evidence needs no task at all: in the cohort re-analysis the autistic children show higher within-trial pupil variability once the shared response is removed and a heavier tail of left–right difference, both while passively watching with no load imposed. I keep the two apart, and my argument rests on the re-analysis alone.
What a median leaves out
The difference I found appears only because I stopped taking the median. In the raw traces the median left–right gap of each child barely separates the two groups (d = 0.44, p = 0.10), the 99th percentile of the same gap separates them clearly (d = 0.81, p = 0.004), and before the shared response is taken out the groups’ mean variability is the same (d = 0.06). A median, like any average, is a decision to keep one number and throw away the rest of what was measured: the spread, the individual moments and the two sides. That is often the right decision, since a summary has to leave things out to be a summary, but whoever chooses the summary has also decided what matters, usually before anyone knows the answer.
The same thing happens whenever a person or a system is reduced to one measure, such as an IQ, a severity score, a diagnosis or a mean pupil size. The measure may serve a real purpose or may only mark how little is understood, standing in for something nobody could yet see, and in either case the reduction costs something, because it keeps the part of the person the measure was built to hold and drops the rest, and the part it drops is often where the person is.
So I kept the eyes apart and worked with the difference between them and its upper tail, because the average had already made the two groups look the same.
“When there is lateral differences in stimulation, it shouldn’t just average the effect... that isn’t how brains work...”My note of 8 July 2026 while building Pilearytix
Pilearytix models this directly, as an arousal system built hemisphere by hemisphere and running right-dominant, with each hemisphere reading its own connectome and the two never merged into one. This page is the bodily side of the same idea, two eyes kept apart so you can watch an average erase the difference between them as it happens.
Background: tonic and phasic firing
Adaptive gain theory (Aston-Jones and Cohen 2005) splits the firing of the locus coeruleus into two modes, and both show in the pupil: the slow tonic baseline sets the resting diameter, and the sharp phasic burst shows as the extra dilation when something relevant to the task happens, such as a decision, a target or the moment the answer to a sum comes to you.
When the tonic baseline is low, the phasic bursts are crisp and well timed, the pattern of focused work on the task in front of you; push the baseline high and the pupil sits wide and jittery while the phasic responses flatten into restless scanning.